
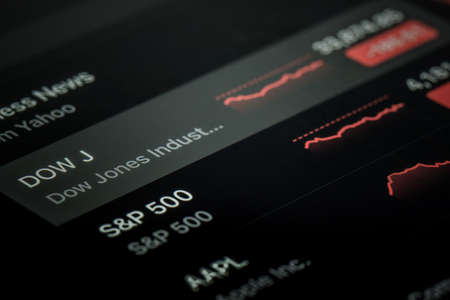
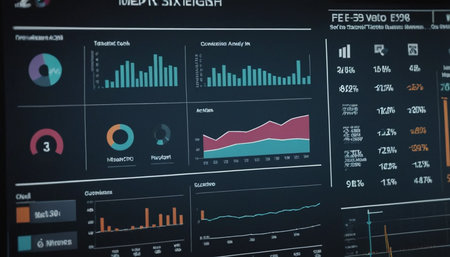
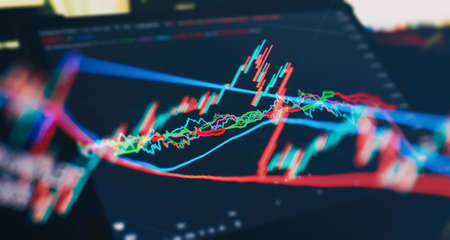
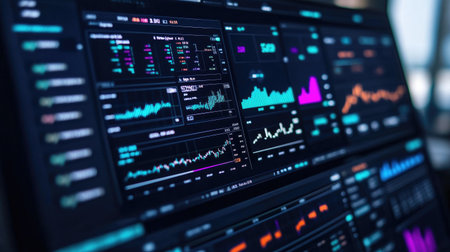
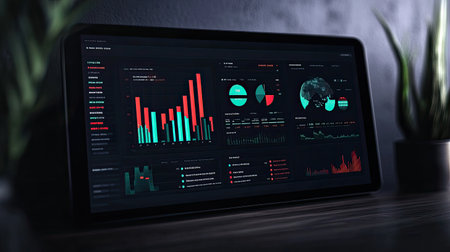
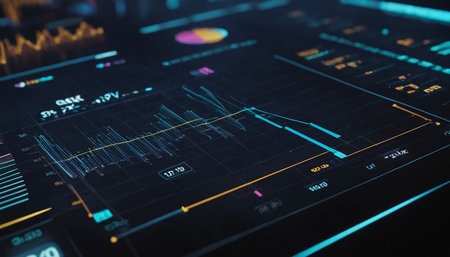
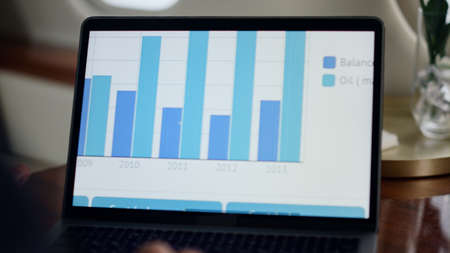
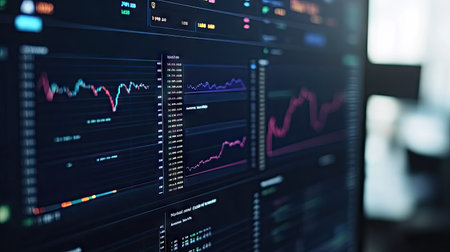
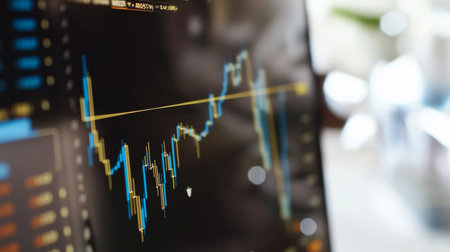
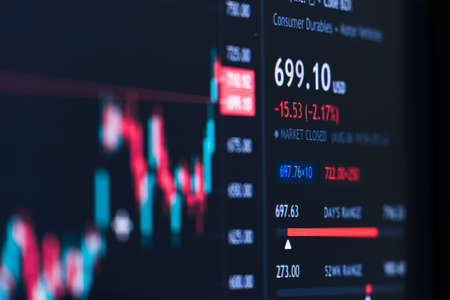
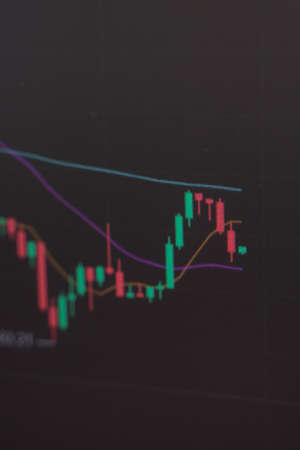
A stock market graph on a black background.
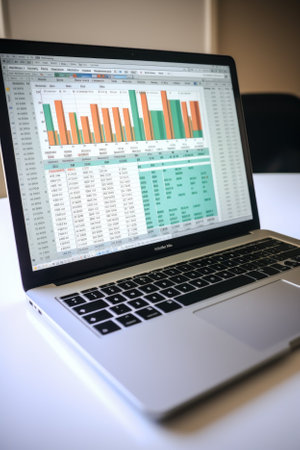
Коллекция по умолчанию
Коллекция по умолчанию
Создать новую

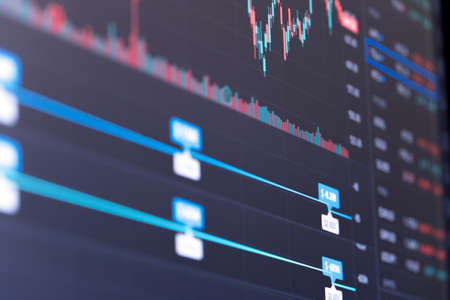
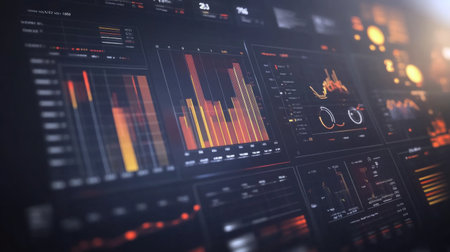
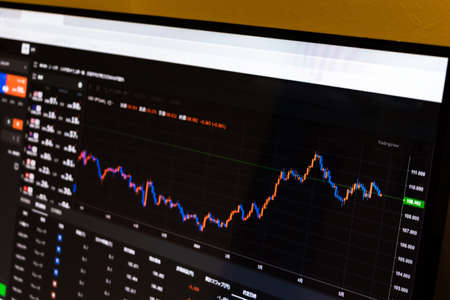
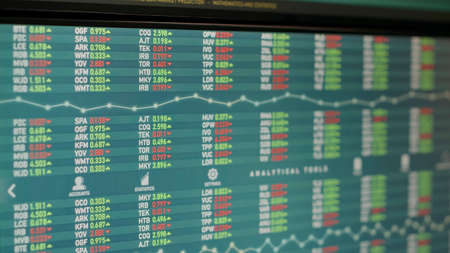
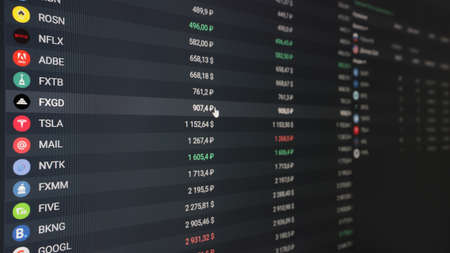
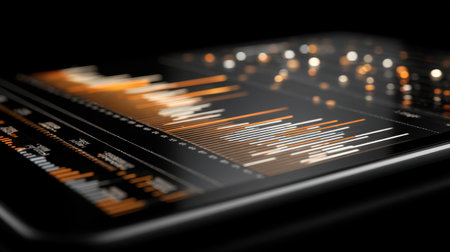
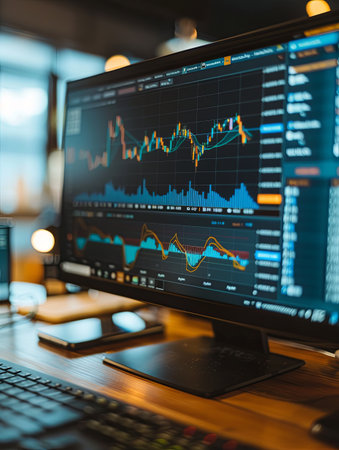
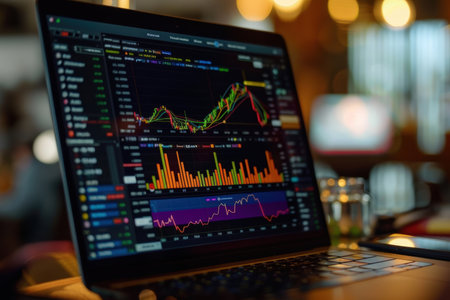
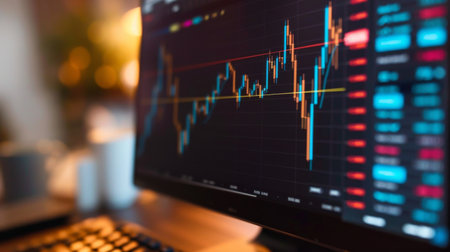
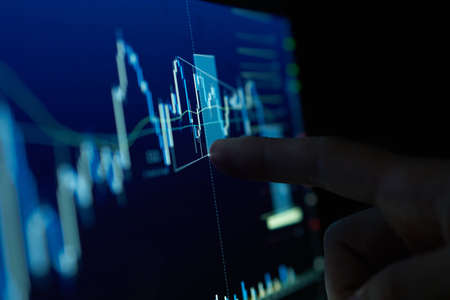
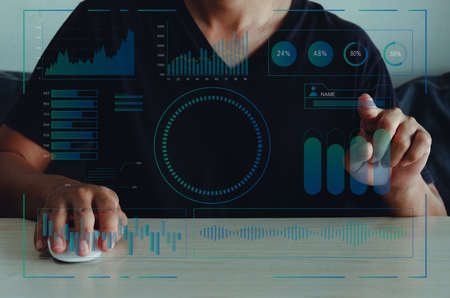
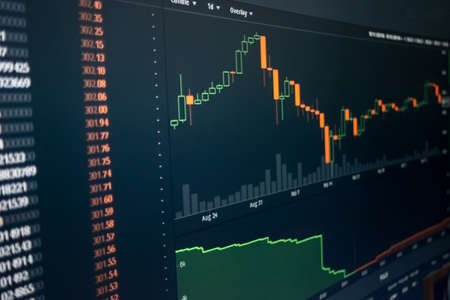
The Stock Exchange, Streaming Trade Screen, The stock screen Show the stock price rise.
Коллекция по умолчанию
Коллекция по умолчанию
Создать новую
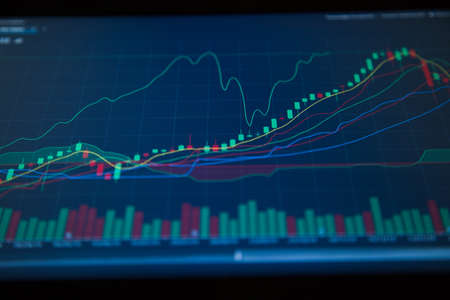
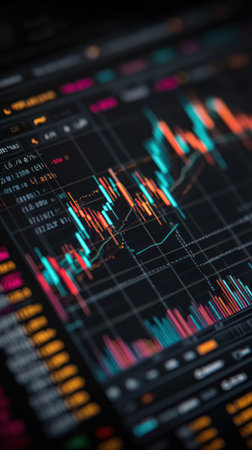
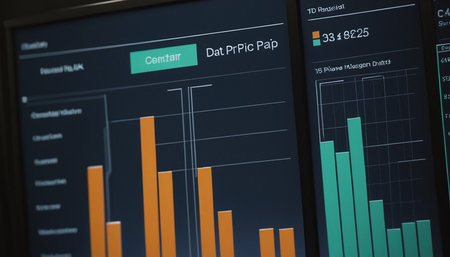
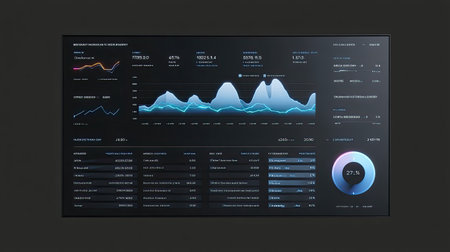
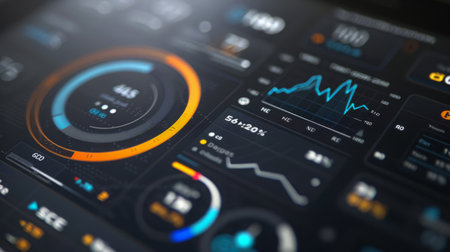
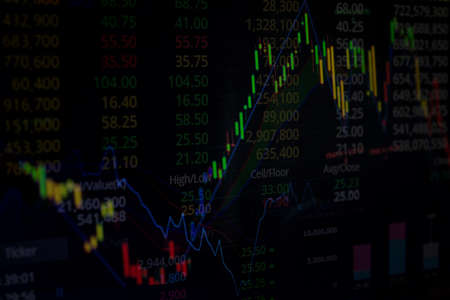
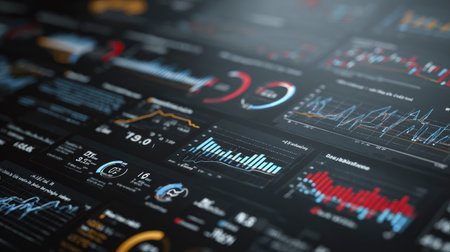
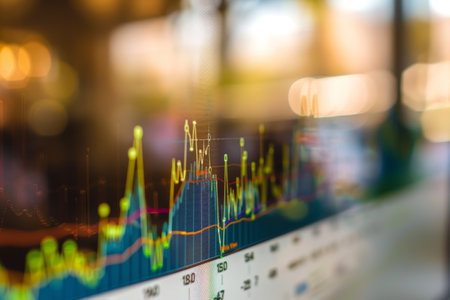
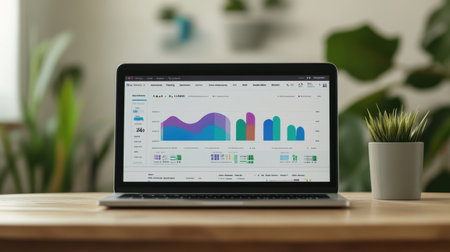
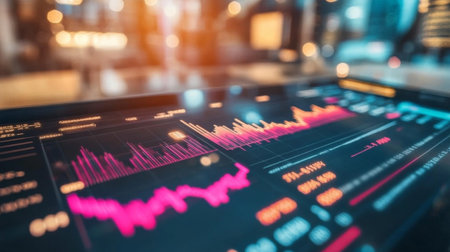
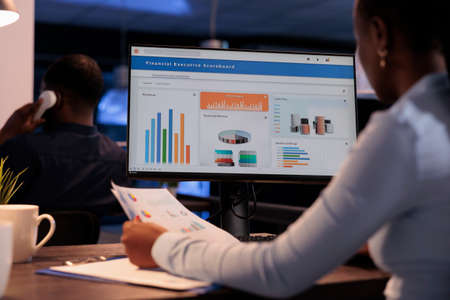
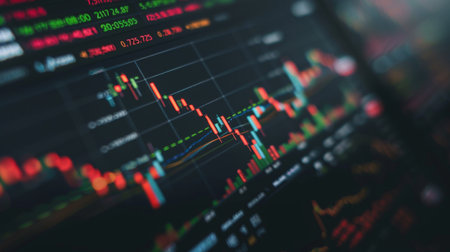
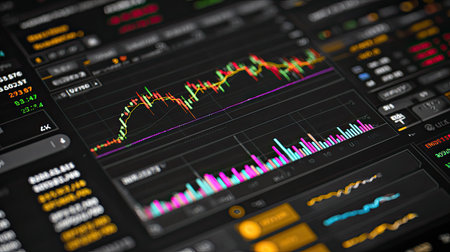
Stock Market Trading Chart Investment Analysis Business Index Chart Finance Board Chart
Коллекция по умолчанию
Коллекция по умолчанию
Создать новую
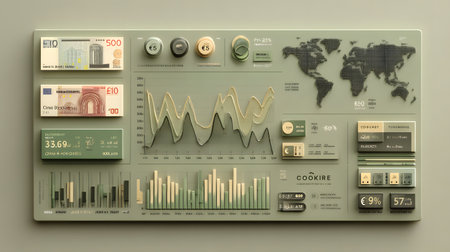
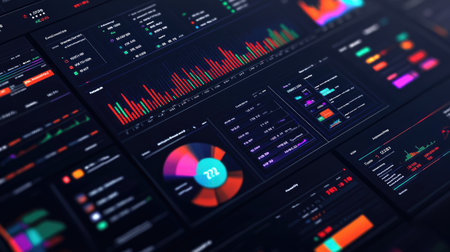
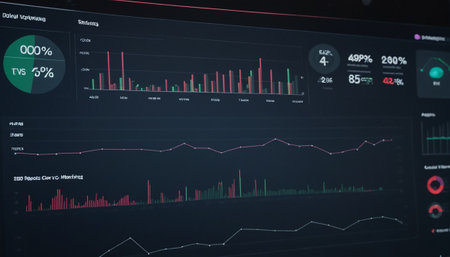
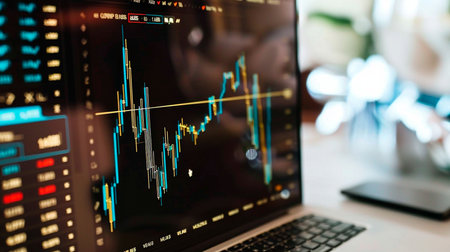
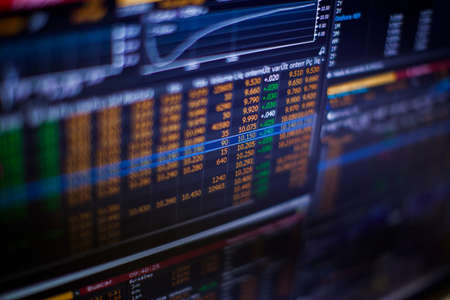
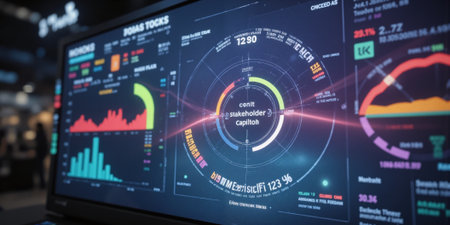
Explore a creative financial data visualization featuring currency notes and detailed charts. Ideal for finance, business, or educational projects.
Коллекция по умолчанию
Коллекция по умолчанию
Создать новую
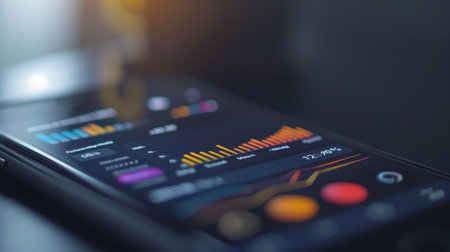
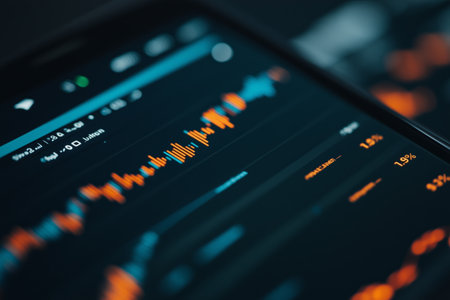
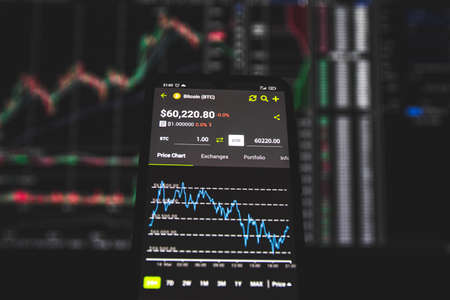
A close-up of a smartphone screen showing a financial app with graphs tracking investment performance and market trends.
Коллекция по умолчанию
Коллекция по умолчанию
Создать новую
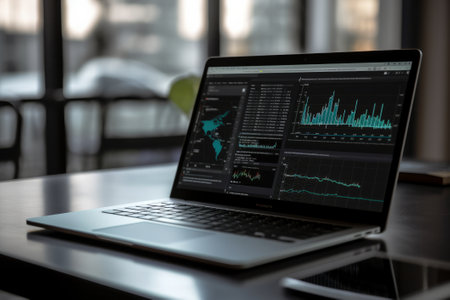
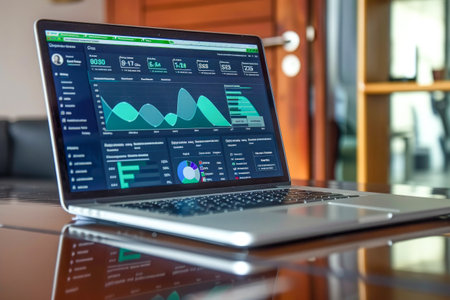
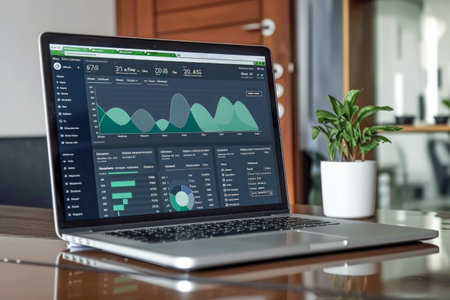
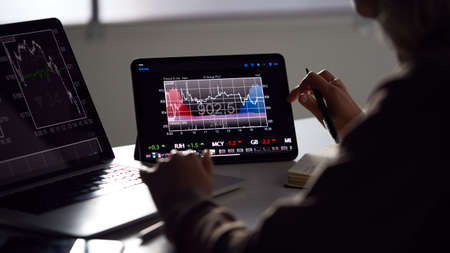
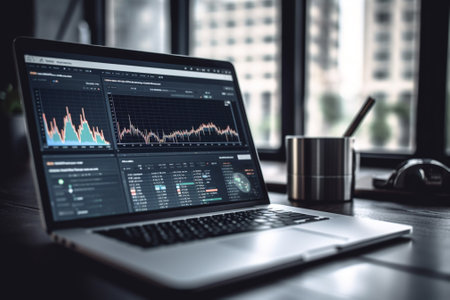
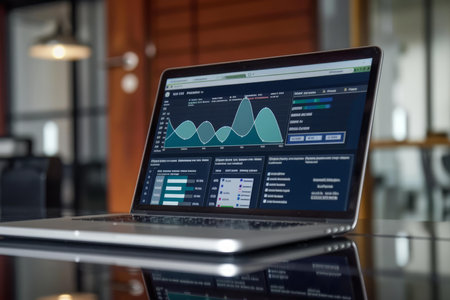
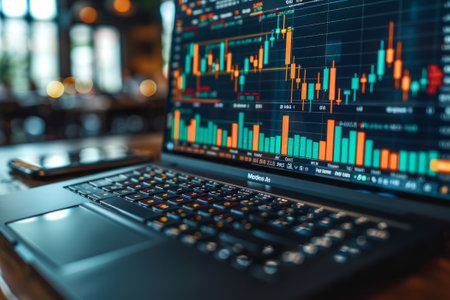
Laptop with the chart on screen. Business and finance concept
Коллекция по умолчанию
Коллекция по умолчанию
Создать новую
Stock Market Chart on Blue Background. share drop down and stock up
Коллекция по умолчанию
Коллекция по умолчанию
Создать новую
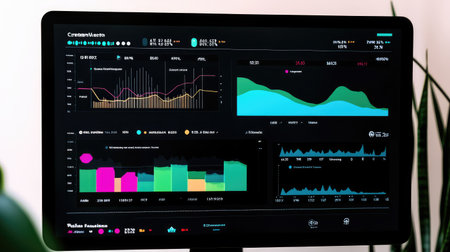
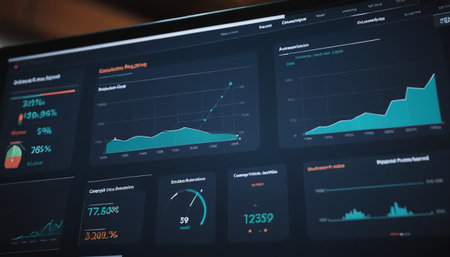
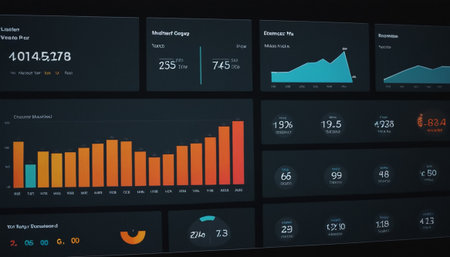
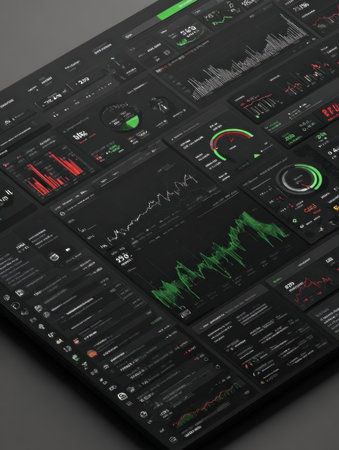
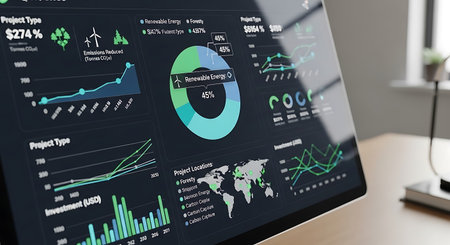
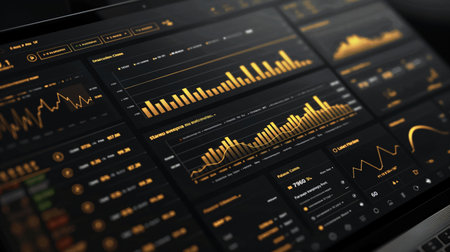
A close-up of a financial dashboard with growth charts and profit reports, providing space to add insights on economic growth, investment strategies, or market expansion
Коллекция по умолчанию
Коллекция по умолчанию
Создать новую
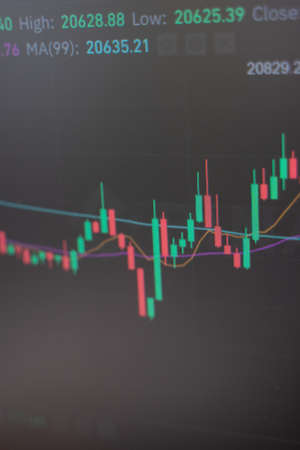
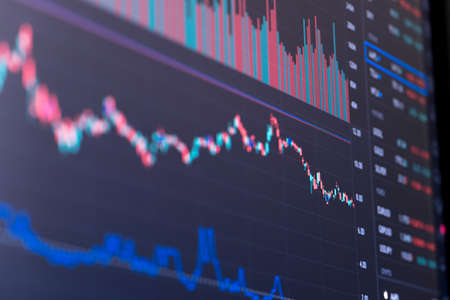
Financial stock market graph. Stock Exchange. Selective focus.
Коллекция по умолчанию
Коллекция по умолчанию
Создать новую
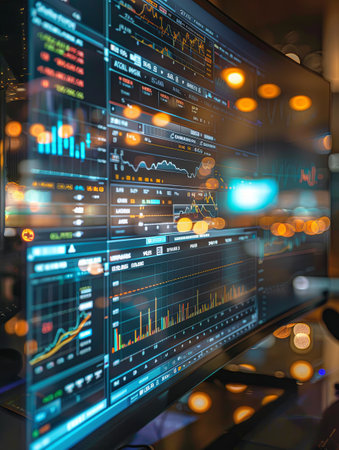
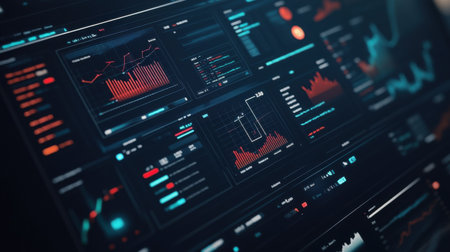
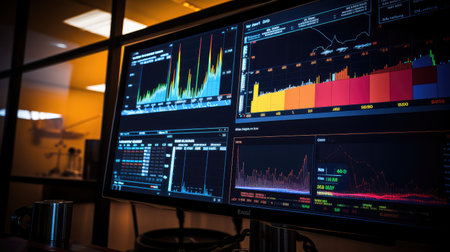
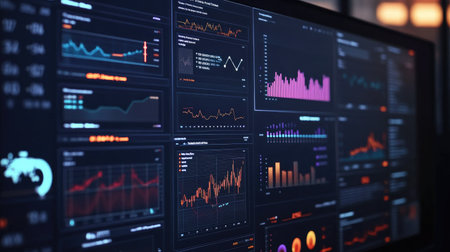
Detailed display on a stock trading terminal shows live market data, graphs, and trends in a financial setting, highlighting investment activity.
Коллекция по умолчанию
Коллекция по умолчанию
Создать новую
Stock market data on monitor screen. Abstract stock market data background. Stock market data on monitor screen. Business financial graph on monitor. Stock market data on monitor.
Коллекция по умолчанию
Коллекция по умолчанию
Создать новую
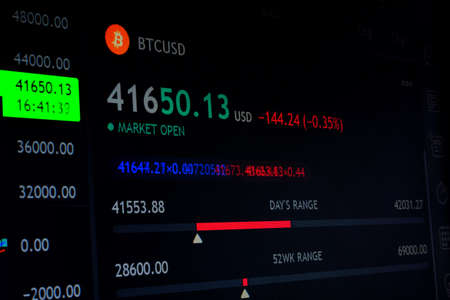
Change the stock market chart. The fall in the value of cryptocurrencies. Brokerage data
Коллекция по умолчанию
Коллекция по умолчанию
Создать новую
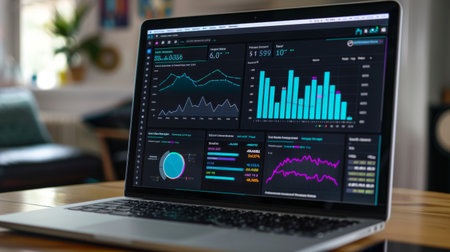
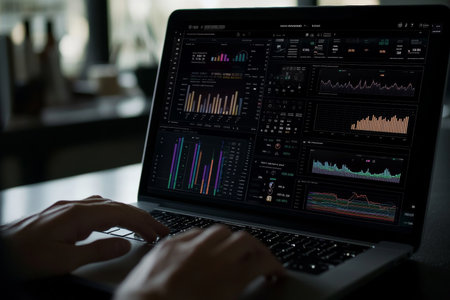
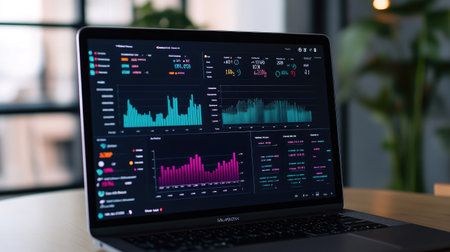
Close-up of a laptop screen with a dashboard displaying various graphs and charts, highlighting data visualization
Коллекция по умолчанию
Коллекция по умолчанию
Создать новую

Shallow depth of field (selective focus) with details of a chart showing the stock market crash from March 2020 due to the Covid-19 pandemic on a computer screen (S&P500 index)
Коллекция по умолчанию
Коллекция по умолчанию
Создать новую
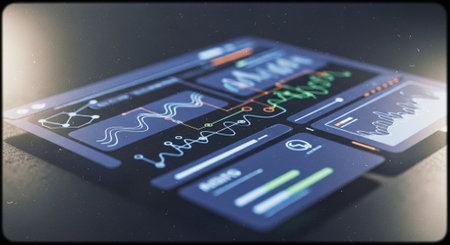
Futuristic screen with charts and graphs. 3d rendering.
Коллекция по умолчанию
Коллекция по умолчанию
Создать новую

A close-up of a digital dashboard with rising investments, offering space for adding content about investment performance, growth, or risk management
Коллекция по умолчанию
Коллекция по умолчанию
Создать новую
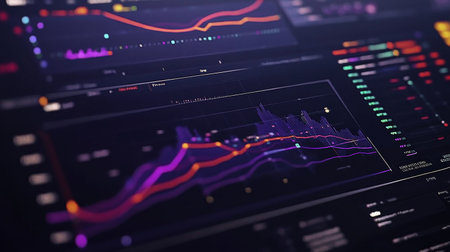
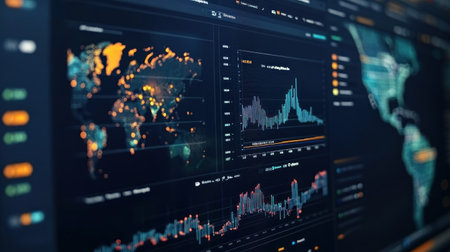
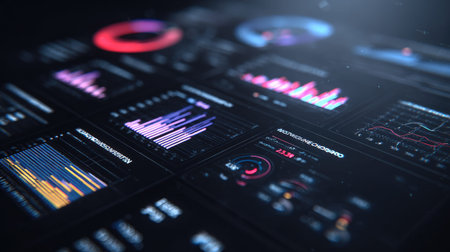
Explore a striking digital landscape showcasing intricate data visualizations. This image features vibrant graphs, charts, and metrics that convey powerful insights and trends in technology and business analytics.
Коллекция по умолчанию
Коллекция по умолчанию
Создать новую

Business success and growth concept.Stock market business graph chart on digital screen. Stock trading, crypto currency background.
Коллекция по умолчанию
Коллекция по умолчанию
Создать новую
A close-up view depicts a detailed chart displaying financial data analysis, with various lines and bars in contrasting colors. The image showcases a digital display with numerical values and graphical representations, suggesting market fluctuations and trading activities. It is suitable for illustrating concepts related to business, finance, and investment.
Коллекция по умолчанию
Коллекция по умолчанию
Создать новую
A visually striking financial dashboard showcasing real-time data and insights, ideal for business analytics and decision-making processes.
Коллекция по умолчанию
Коллекция по умолчанию
Создать новую
Futuristic interface display with charts and graphs. 3D rendering
Коллекция по умолчанию
Коллекция по умолчанию
Создать новую
A Line Graph Illustrates the Rewards of Long-Term Investment
Коллекция по умолчанию
Коллекция по умолчанию
Создать новую
An interactive crowdfunding dashboard showcases real-time analytics, featuring detailed graphs and charts that track campaign performance metrics effectively. User engagement is highlighted.
Коллекция по умолчанию
Коллекция по умолчанию
Создать новую
Stunning abstract data visualization featuring colorful graphs and charts. Ideal for illustrating statistics, analysis, or technology concepts in modern contexts.
Коллекция по умолчанию
Коллекция по умолчанию
Создать новую

financial graph on monitor for business and finance concept. shallow depth of field
Коллекция по умолчанию
Коллекция по умолчанию
Создать новую
A digital dashboard displaying key business metrics, showcasing sales performance and data analytics.
Коллекция по умолчанию
Коллекция по умолчанию
Создать новую
Business statistics and Analytics value . Abstract glowing forex chart interface background. Investment, trade, stock, finance and analysis concept.
Коллекция по умолчанию
Коллекция по умолчанию
Создать новую
Financial data analyzing on monitor. Abstract financial data analysis on monitor.
Коллекция по умолчанию
Коллекция по умолчанию
Создать новую
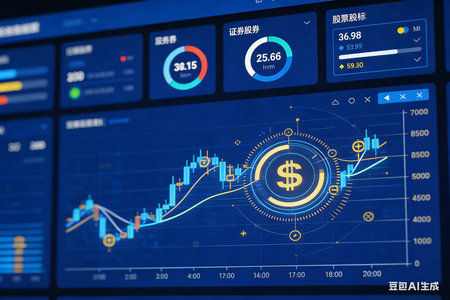
Stock market data chart on digital screen. Finance and investment concept. 3D Rendering
Коллекция по умолчанию
Коллекция по умолчанию
Создать новую
Close-up of a stock trading dashboard with multiple charts showing various stock performance metrics
Коллекция по умолчанию
Коллекция по умолчанию
Создать новую
Overview of a financial dashboard showcasing various market data with graphs and metrics. Ideal for business analysis and strategic decision-making processes.
Коллекция по умолчанию
Коллекция по умолчанию
Создать новую
Forex chart displayed on the monitor
Коллекция по умолчанию
Коллекция по умолчанию
Создать новую
Stock market data on monitor. Financial graph on monitor. Stock market data on monitor. Stock market data on monitor. Business graph on monitor. Stock market data on monitor.
Коллекция по умолчанию
Коллекция по умолчанию
Создать новую
Shopee data dashboard showcasing trend indicators, sales performance, and pie charts on a dark interface, with ample room for copy.
Коллекция по умолчанию
Коллекция по умолчанию
Создать новую
A Line Graph Illustrates the Rewards of Long-Term Investment
Коллекция по умолчанию
Коллекция по умолчанию
Создать новую
Close Up Of A Digital Display Showing Data And Charts
Коллекция по умолчанию
Коллекция по умолчанию
Создать новую
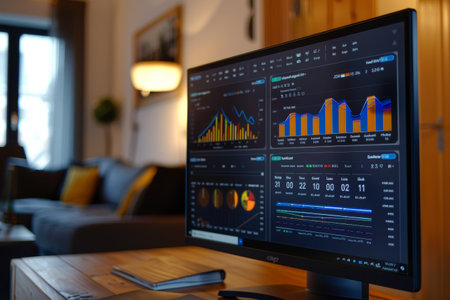
A monitor with a graph displayed on it is placed on a table in a living room, Incorporate interactive graphs and charts to visualize energy usage and cost savings
Коллекция по умолчанию
Коллекция по умолчанию
Создать новую
Professional using laptop with virtual screens for financial analysis in modern office setting
Коллекция по умолчанию
Коллекция по умолчанию
Создать новую
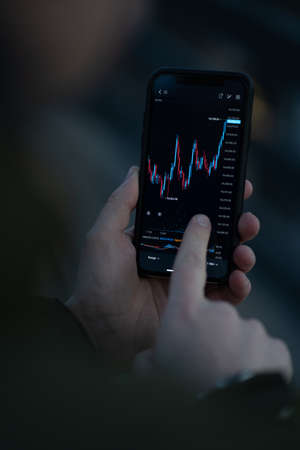
Trader checking stock market data in mobile app for trading online. Male hand touching smartphone screen with real time forex chart, reading financial news and analyzing price flow, selective focus
Коллекция по умолчанию
Коллекция по умолчанию
Создать новую
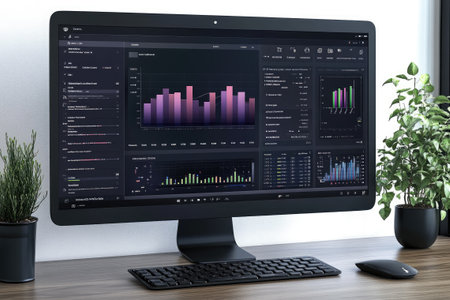
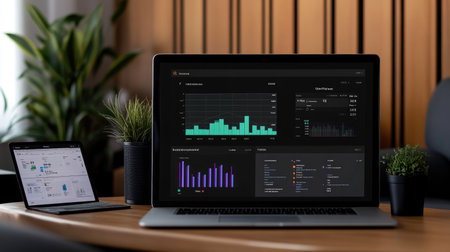
Home office desk with a desktop computer displaying financial data and surrounded by plants
Коллекция по умолчанию
Коллекция по умолчанию
Создать новую
Real time stock sales statistics with global hedge fund on monitor, trade exchange numbers changing after buying and selling money. Financial investment with profit. Close up. Tripod shot.
Коллекция по умолчанию
Коллекция по умолчанию
Создать новую
Smartphone and Tablet pc with financial charts and graphs on office desk, business concept
Коллекция по умолчанию
Коллекция по умолчанию
Создать новую
Graphs and charts on a computer showing financial planning.
Коллекция по умолчанию
Коллекция по умолчанию
Создать новую
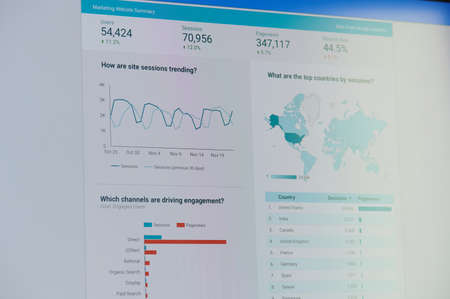
New york, USA - November 24, 2020: Google ads marketing website summarydashboard on laptop screen
Коллекция по умолчанию
Коллекция по умолчанию
Создать новую

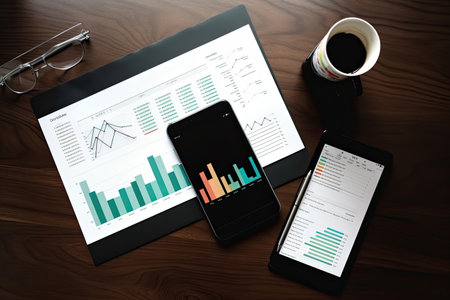
A sleek home office features a laptop displaying financial charts, accompanied by a smartphone, documents, and a steaming cup of coffee.
Коллекция по умолчанию
Коллекция по умолчанию
Создать новую
charts oil rig data
Коллекция по умолчанию
Коллекция по умолчанию
Создать новую
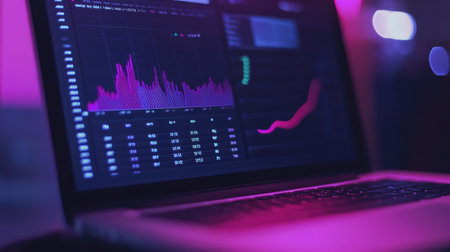
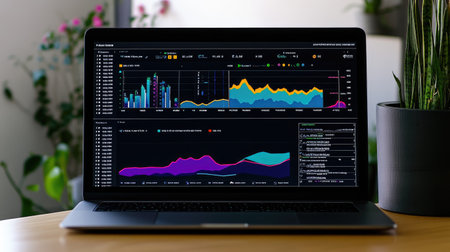
A focused view of a laptop displaying abstract financial data visualizations in a dim environment illuminated by purple lighting. Ideal for finance and tech visuals.
Коллекция по умолчанию
Коллекция по умолчанию
Создать новую

Glowing data charts displayed on a laptop signify analysis in a contemporary office setting during evening hours.
Коллекция по умолчанию
Коллекция по умолчанию
Создать новую
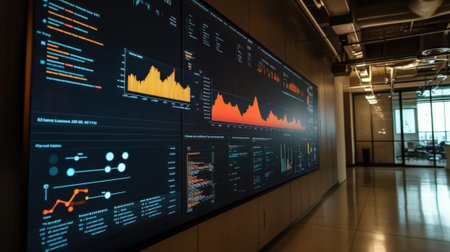
A focused shot of a large screen featuring realtime data visualization tools showcasing interactive segments filled with KPIs and metrics. The screen highlights areas of performanc
Коллекция по умолчанию
Коллекция по умолчанию
Создать новую
Stock Market Loss Trading Chart Investment Analysis Business Index Chart Finance Board Chart
Коллекция по умолчанию
Коллекция по умолчанию
Создать новую
Global e-commerce dashboard displaying sales analytics, close-up of charts and graphs.
Коллекция по умолчанию
Коллекция по умолчанию
Создать новую
A close-up view of a digital dashboard showcasing various data visualizations. This image features colorful graphs and charts, ideal for illustrating analytics and performance insights in a modern workspace.
Коллекция по умолчанию
Коллекция по умолчанию
Создать новую
Close-up of a laptop screen displaying a business analytics dashboard, with data and charts.
Коллекция по умолчанию
Коллекция по умолчанию
Создать новую

Stock market graph on screen. Ticker on monitor screen. Investing, Finance and Economic concept. Shallow depth of field.
Коллекция по умолчанию
Коллекция по умолчанию
Создать новую
A laptop showcasing a vibrant data visualization dashboard with colorful graphs and charts, set in a contemporary workspace filled with greenery and soft light.
Коллекция по умолчанию
Коллекция по умолчанию
Создать новую
Grow Stock market trading graph in graphic concept.financial investment or economic trends business design. Abstract finance background.Low angle shot.
Коллекция по умолчанию
Коллекция по умолчанию
Создать новую
Ufa, Russia November 11, 2021: Laptop screen with stock market charts. Technical analysis and fundamental indicators of stock quotes in the trading terminal. Japanese candlesticks and company tickers.
Коллекция по умолчанию
Коллекция по умолчанию
Создать новую
This image features an intricate layout of modern data visualizations, showcasing various colorful graphs and charts ideal for business analytics and performance reviews.
Коллекция по умолчанию
Коллекция по умолчанию
Создать новую

Cryptocurrency graph as Bitcoin graphs on the device as computer laptop, smartphone at home. Young money investing concepts.
Коллекция по умолчанию
Коллекция по умолчанию
Создать новую
Analytics dashboard showcasing dynamic data trends on a smartphone screen during evening analysis session
Коллекция по умолчанию
Коллекция по умолчанию
Создать новую
Close Up Of Female Share Trader At Desk With Stock Price Data Displayed On Laptop And Digital Tablet
Коллекция по умолчанию
Коллекция по умолчанию
Создать новую
Stock market data on LED screen. Finance and trade concept. 3D Rendering
Коллекция по умолчанию
Коллекция по умолчанию
Создать новую
A sleek digital tablet showcases a vibrant data visualization with orange and white bars, reflecting modern analytics and interactive design.
Коллекция по умолчанию
Коллекция по умолчанию
Создать новую

Analysis business accounting on info sheets. Businessman hand working on analyzing investment charts for Gold market, Forex market and Trading market.
Коллекция по умолчанию
Коллекция по умолчанию
Создать новую
Detailed view of a graph displayed on a digital screen, showing trend analysis for website traffic flow, Incorporate trend analysis for website traffic fluctuations
Коллекция по умолчанию
Коллекция по умолчанию
Создать новую

Tyumen, Russia - JULY 18, 2019: Cryptocurrency exchange mobile trading Bitcoin. Blur effect
Коллекция по умолчанию
Коллекция по умолчанию
Создать новую
desktop compucomputer with financial data graph
Коллекция по умолчанию
Коллекция по умолчанию
Создать новую

A futuristic interface displaying global business analytics and trends.
Коллекция по умолчанию
Коллекция по умолчанию
Создать новую
Closeup laptop screen charts on airplane trip. Wealthy ceo checking statistics company diagram. Unrecognized businessman passenger typing computer analyzing finance growth. Business expert concept.
Коллекция по умолчанию
Коллекция по умолчанию
Создать новую
A computer monitor displaying financial charts and graphs sits on top of a wooden desk. Generative AI
Коллекция по умолчанию
Коллекция по умолчанию
Создать новую

Shallow depth of field (selective focus) with details of a candlestick chart on a computer screen.
Коллекция по умолчанию
Коллекция по умолчанию
Создать новую
A sleek laptop shows vibrant data visualizations on its screen, surrounded by a serene workspace setting with a green plant, ideal for business and analytics projects.
Коллекция по умолчанию
Коллекция по умолчанию
Создать новую
Real live stock exchange trading stocks display panel. high quality photo
Коллекция по умолчанию
Коллекция по умолчанию
Создать новую

A laptop displaying colorful graphs and charts, representing data analysis and business insights in a modern workspace.
Коллекция по умолчанию
Коллекция по умолчанию
Создать новую
Dynamic financial dashboard displays various metrics, charts, and analytics for market performance, capturing live changes in stock and cryptocurrency values.
Коллекция по умолчанию
Коллекция по умолчанию
Создать новую
Cryptocurrency exchange chart. Bitcoin price goes up to 60 000 dollars. Blockchain and digital money
Коллекция по умолчанию
Коллекция по умолчанию
Создать новую
Close-up view of colorful stock market charts and data on a digital screen in a modern office, highlighting analysis and financial trends for informed decision-making.
Коллекция по умолчанию
Коллекция по умолчанию
Создать новую
Laptop with financial chart on screen. Accounting and investment concept.
Коллекция по умолчанию
Коллекция по умолчанию
Создать новую
Close-up of a stock trading dashboard with multiple charts showing various stock performance metrics
Коллекция по умолчанию
Коллекция по умолчанию
Создать новую

A close-up of a futuristic holographic interface with glowing transparent screens displaying various financial charts and data.
Коллекция по умолчанию
Коллекция по умолчанию
Создать новую
AI Financial Analysis Software Display with Colorful Charts and Key Performance Metrics for Decision Making
Коллекция по умолчанию
Коллекция по умолчанию
Создать новую
Office employee analyzing business charts on computer and documents, looking at online research data to create presentation. Working with information on report, statistics on pc.
Коллекция по умолчанию
Коллекция по умолчанию
Создать новую
Data Analytics Stock market Business insights Graphs shown on monitor for strategic decisions in office today
Коллекция по умолчанию
Коллекция по умолчанию
Создать новую
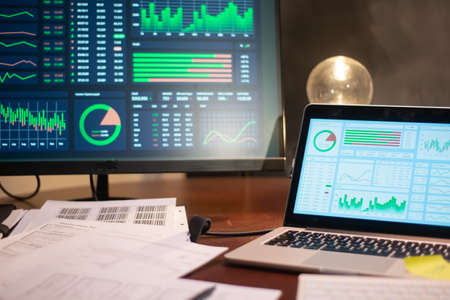
Laptop, papers and computer on table. Gadgets and other late night work stuff needed for late night work in office. Technology, job, office concept
Коллекция по умолчанию
Коллекция по умолчанию
Создать новую
Close-up of a financial graph on a computer screen, showcasing upward and downward trends with detailed line and bar charts.
Коллекция по умолчанию
Коллекция по умолчанию
Создать новую
A close-up of a stock market trading screen displaying fluctuating graphs and charts of various stocks.
Коллекция по умолчанию
Коллекция по умолчанию
Создать новую
View of a Business data displayed on a futuristic interface - 3d rendering
Коллекция по умолчанию
Коллекция по умолчанию
Создать новую
Financial stock market graph. Stock Exchange. Selective focus.
Коллекция по умолчанию
Коллекция по умолчанию
Создать новую
Laptop displaying graphs and charts sits on a desk, reflecting the surrounding office environment
Коллекция по умолчанию
Коллекция по умолчанию
Создать новую
This image showcases a modern dashboard filled with colorful graphs and data visualizations, ideal for illustrating business performance and analytical insights.
Коллекция по умолчанию
Коллекция по умолчанию
Создать новую
A desktop computer screen displaying a colorful line graph depicting revenue growth over the past year.
Коллекция по умолчанию
Коллекция по умолчанию
Создать новую
Financial chart on laptop. Business and finance concept.
Коллекция по умолчанию
Коллекция по умолчанию
Создать новую
Program, programming, program, screen, monitor, computer, laptop, hacker, hacking.
Коллекция по умолчанию
Коллекция по умолчанию
Создать новую
Close-up view of a stock exchange monitor with financial charts and graphs
Коллекция по умолчанию
Коллекция по умолчанию
Создать новую
Financial stock market graph. Stock Exchange. Selective focus.
Коллекция по умолчанию
Коллекция по умолчанию
Создать новую
Futuristic touch user interface. 3d rendering toned image
Коллекция по умолчанию
Коллекция по умолчанию
Создать новую
Bitcoin. Change the price on the display. Brokerage information, display of the price of the electronic means of payment
Коллекция по умолчанию
Коллекция по умолчанию
Создать новую
Wooden cubes with WEB 3.0 symbol on background and copy space.Business concepts.
Коллекция по умолчанию
Коллекция по умолчанию
Создать новую
This image showcases a close-up view of a financial trading interface, highlighting colorful charts and stock market data on a dark screen, perfect for finance-related content.
Коллекция по умолчанию
Коллекция по умолчанию
Создать новую
Stockmarket diagram and grah on displayscreen
Коллекция по умолчанию
Коллекция по умолчанию
Создать новую
Legion-Media
Создайте свои проекты на основе качественных стоковых фотографий и видео.


Copyright © Legion-Media.